| Overall | 15W 6L 2T |
| District | 5W 0L 1T |
| Expected | 18: 1+ 4- |
":" = Games won or lost as expected,
"+" = Games won against stronger team,
"-" = Games lost against weaker team)
|
7 2 1 Rank in State, Class, District |
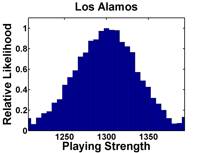
1300 139 Strength Momentum |
1071 63.1(6) SOS, RPI(RPI Rank) |
":" = Games won or lost as expected, "+" = Games won against stronger team, "-" = Games lost against weaker team) | |
| Date | Opponent1 | RGWF4 | Opp Strength | Result | Expectation2 | Playing Strength | P(Win)3 | Send |
|---|---|---|---|---|---|---|---|---|
| 08/25/15 | at Bosque | 0.000 | 1309 | T 2- 2 | Better (0) | 1314 | 45% |  |
| 08/28/15 | Clovis | 0.000 | 1189 | W 2- 1 | Expected (0) | 1285 | 71% | |
| 08/29/15 | Bosque !! | 0.000 | 1309 | W 2- 1 | Expected (+1) | 1345 | 52% | |
| 08/29/15 | Goddard | 0.000 | 996 | W 2- 1 | Expected (-2) | 1189 | 91% | |
| 09/02/15 | St. Michael's | 0.001 | 904 | W 3- 0 | Expected (-1) | 1243 | 94% | |
| 09/04/15 | at St. Pius ?? | 0.001 | 1071 | L 0- 2 | Worse (-4) | 1095 | 82% | |
| 09/10/15 | at Cleveland ! | 0.005 | 1236 | W 1- 0 | Expected (+1) | 1328 | 58% | |
| 09/11/15 | at Albuquerque Academy | 0.006 | 1495 | L 0- 2 | Expected (0) | 1307 | 18% | |
| 09/12/15 | at Capital | 0.007 | 961 | W 1- 0 | Expected (-2) | 1190 | 90% | |
| 09/15/15 | at Albuquerque Academy | 0.005 | 1495 | L 0- 6 | Expected (-4) | 1103 | 18% | |
| 09/17/15 | Rio Rancho | 0.014 | 1315 | L 0- 2 | Worse (-2) | 1198 | 50% | |
| 09/22/15 | at Capital | 0.034 | 961 | W 2- 1 | Expected (-2) | 1190 | 90% | |
| 09/26/15 | Taos ? | 0.054 | 1104 | L 1- 3 | Worse (-4) | 1092 | 82% | |
| 09/30/15 | at Santa Fe | 0.077 | 1050 | W 3- 0 | Expected (+1) | 1335 | 83% | |
| 10/03/15 | at Bernalillo | 0.050 | 884 | W 7- 1 | Expected (+2) | 1406 | 94% | |
| 10/06/15 | at Del Norte | 0.121 | 798 | W 4- 0 | Expected (-1) | 1260 | 96% | |
| 10/10/15 | Capital | 0.291 | 961 | T 2- 2 | Worse (-4) | 1121 | 92% | |
| 10/17/15 | at Piedra Vista | 0.171 | 801 | W 7- 1 | Expected (+1) | 1364 | 96% | |
| 10/21/15 | Bernalillo | 0.054 | 884 | W 10- 0 | Expected (+6) | 1602 | 95% | |
| 10/24/15 | at Del Norte | 0.444 | 798 | W 4- 0 | Expected (-1) | 1260 | 96% | |
| 11/05/15 | * St. Pius | 0.826 | 1071 | W 3- 0 | Expected (+1) | 1326 | 84% | |
| 11/06/15 | * Roswell | 0.988 | 1197 | W 1- 0 | Expected (0) | 1289 | 68% | |
| 11/07/15 | * Albuquerque Academy | 0.931 | 1495 | L 0- 2 | Expected (0) | 1307 | 20% | |
|
Notes: 1Games against an opponent in the same district are shown in bold letters; may NOT be an actual district game Numbers in parentheses for reported games are the goals Los Alamos actually scored, relative to what ratings predicted 2Numbers listed for unreported/future games are the most probable winning margin 3P(Win) is the expected winning Percentage -- the statistical success rate for predicting the game winner between teams of this strength difference 4RGWF is the relative weight factor for this game * Game at a neutral site, or unable to determine which team gets home field advantage |
The median opponent strength is 1071, while
Los Alamos's "weighted playing strength" is 1290
(where a win by 4 goals counts 0.65 as much as a 1 goal win, and
a game played on 10/17/15 counts 0.5 that of one played on 11/07/15)
Go back to ratings for Boys Varsity Girls Varsity Main Page